
Fig.1A
| Russian
|

|
|
Fig.1A |

| h - |
the parameters
determining the position of a segment; |
| H - |
area of admissible
values of parameters h; |
| n - |
the number of
points of an approximated set; |
| d_i - |
a deviation
of an isolated point from an axial line of a segment (fig.1B). |

|
| Fig.1B |


|
| Fig.1a |
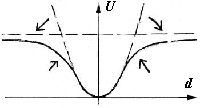
Here the physical essence - functional basis of approximation problem is evidently illustrated. The further the point will desposed from an axial line of a tried image, the more its contribution in minimized functional, - the more its influence on result of approximation, - the more force from which this point draws approximating image.
Basically it should be so. At approximation the model should be tightened to the remoted points. However, all this defines the desirable outcome if the approximated points lay on the true places (defined by a form of model) or are scattered integrally symmetrically (in particular, under the normal law). Otherwise, as it was already marked, outside points can deform essentially necessary outcome, having led away an approximating segment on themselves.
|
| Fig.10c |
|
| Fig.1a_ |
Reflections in this occasion lead to a natural conclusion
about necessity of smooth restriction of influence of the removed points.
For this purpose it is necessery, figuratively speaking, "to unbend" branches
of a parabola (potential function) up to asymptotic approach to some horizontal ceiling
(fig.1a_). It is on the base that fare points must be equally indifferent
ones.
More precisely to understand an essence of this decision,
- we shall pass from integrated - a potential picture, - to its
differential - force represantation. Till now last interpretation
was considered as something "by itself understood". We shall give to it
greater strictness.

|
| Fig.1b |

|
| Fig.1c |

|
| Fig.1d |
The force interpretation of the approximation problem directly
prompts a natural exit from this situation. It is necessary to
pass from the orthodox threshold limitation of influence (attraction) of
remote points (fig.1c) to gradual smooth one (fig.1d).
In frame of such force dependence should will be solved a task of search
of balance position in real conditions, - at presence of essential interferences
as which points neighboring - extraneous objects can act.
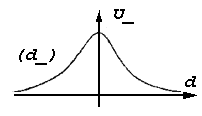
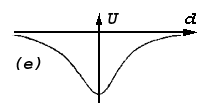
Return from this position in frameworks of potential interpretation also gives back bell-like potential function. Let's show it.
|
|
| Fig.1d_,1e |
The application here the force - differential interpretation enables more distinctly to formulate the problem and explain essentiality of its solving. Instead of reasoning about some ceiling it is defined that force attraction must have tendency to zero under increasing of deviation. Force interpretation too more stringently explains approximation role of central part of potential curve (of parabolas rest - potential pit). Instead of (in addition to) reasoning about that points must roll down on its bottom, here it is giving direct representation about attracting force - it must be inversely proportional to deviation with changing of sign in pass through zero. In frame of force interpretation it is logically easier linked root-mean-square approximation and threshold admittance of allowed deviation (fig.1c).

|
| Fig.1f |
It is possible to reach a bell-like membership function also directly by "smoothing" - "melting" of
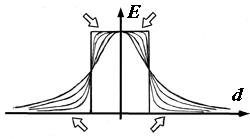
Fig.1f_
-like - threshold function (fig.1f_). However, additional explanations about the functional roles of various pieces of this smoothing are needed. First of all, it is necessary attention to approximation role that begin to play center - top of such smoothing. All these roles are directly illustrated by force interpretation. The force interpretation links together the operation principles of root-mean-square approximation, threshold limitation of permissible deviation,
-like membership function and their development - bell-like estimation of this membership. The force interpretation instead of a series generally accepted reservations gives here descriptive - force - causal sections.

| h
- |
the parameters defining the position and orientation of a segment (generally, and its shape); |
| H
- |
area of admissible values of parameters h; |
| T(h)
- |
subset of points
of images, belonging to individual approximating segment (some ideal image
of this segment, - "band" of points ambient its axial line); |
| T_o
- |
set of contour
points detected on the image; |
| S
- |
measure of geometrical conformity of T(h) set (image) to T_o set. |


|
| Fig.2 |

Where
| d - |
value of a deviation
from the axial line of an approximating segment which position is defined
by parameters h; |
| D -
|
defines a deviation
at which the value of function of a membership decreases twice (further
the double value of such deviation we shall name its width). |
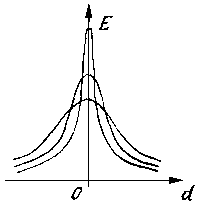
The
cross-section of a set of the bell-like functions defined by this expression
is shown on fig.2b.
Further
alongside with the term bell-like we shall use also the term fuzzy,
proposed in [4] as a generalizing title for
a similar sort of functions.

Were
| h - |
parameters defining
a position of an approximating segment, |
| T_o - |
a set of chosen
contour points,
|
| d_t - |
a deviation
of the point - t from an approximating segment. |
Thus,
mathematical expression of such measure, for a case of approximation by
straight lines, is defined as follows:

Where
| declination
of the perpendicular radius-vector let down from the center of coordinates
on an approximating line (fig.3a), |
|
| length of this
vector, |
|
| d_i - |
a deviation
of i-th contour point from the axial line = x_i * cos( |
| x_i, y_i
- |
coordinates of a point, |
| n - |
number of contour
points. |
Hereinafter
in terms of a conformity measure we shall omit (implying its presence)
parameter T_o designating a set of contour points.

|
| Fig.3 |

|
| Fig.4 |
Therefore,
in general the desire to remain, whenever possible, within the framework
of the problem solution (i.e finding of the minimum of a pure root-mean-square
deviationis) is natural.
However,
the minimum of a standard deviation as it has been shown, inherently reflects
globally averaged conformity of the model (a tried on pattern) with analysis
pattern. In this case the conformity measure monotonically decreases with increase of
a deviation of any element of the analysed pattern from a corresponding
element of the tried on model.
Derivation
of the adequate description of any picture with the help of such conformity measure
can be obtained only in a case when among compared models there is a model
of all analysed pattern. In this case, minimizing a summarized deviation,
we can obtain search outcome, i.e. to find a corresponding model. Otherwise,
we shall obtain an averaging of an analysed pattern of one of available
models that can not have anything common with necessary outcome - an adequate
description of the given pattern or even of its part.
Effectiveness
of use of the criterion of summarized (root-mean-square) deviation directly
depends on as far as we can legiblly select an approximated pattern from
its environment or as far as we can fully reflect an analysed picture
with any integral model. From this viewpoint it is possible to select two
approaches in a solution of the problem of the description of pictures
of various kind on the basis of minimization of a root-mean-square deviation:
- Sequential
independent detection and approximation of individual included as the parts
in the analysed picture [1, 5, 6, 13], in particular,
of separate segments of contour boundaries.
- Approximation
of input data with integral models (see, for example, [8 - 12]), in particular, contour boundaries with
chains of segments;
Adequacy
descriptions obtained on the basis of last approach to theanalysed pictures
is ensured, first of all, with that here elements (points) of input data
in a result will be distributed between corresponding elements (segments)
of tried on models and will not render so negative towing away
influence on adjacent elements (segments) of the tried on model. For example,
if to approximate an angle (see fig.1A, fig.3) with a corresponding integral
model (a chain of two segments), basically, it is possible to obtain an
adequate outcome even within the framework of pure standard approximation.
However,
such approach is effective only as fine tuning when a priori there
is an initial approximation - a model already enough well reflecting an
analysed picture, a model which needs to be ajusted only. The prerogative
of definition of such initial models remains behind the first approach
- sequential contextual independent detection and approximation of separate
subpatterns.
In
a solution of this problem, in turn, also it is possible to select two approaches,
depending on a detection mode of elements belonging to separate subpatterns:
-
A priori detection - unguided by tried on models during approximation
[5, 6, 13];
- Detection
controlled during approximation (see, for example, [1]), - a rejection of the elements allocated far
from corresponding elements of the tried on model.
A virtue
of the first approach consists that at its application the root-mean-square
approximation is used in the pure view, with computing simplicity
implying from here. However, such approach can be used only for representation
of analysed pictures with the simplest ones , i.e. with elementary patterns.
These patterns should represent adequately enough any arbitrarily chosen
piece of a described picture (anyway,the majority of such pieces). Such
requirement can be satisfied only for representation in terms of the simplest
patterns were at a discretization level of the representation
of input data. For images such elements are pieces of several raster points
(about 5 - 10). Only on such pieces, contour boundaries with an adequate
accuracy can be described by rectilinear segments - the simplest universal
patterns in which terms the arbitrary contour configuration basically
can be circumscribed.
A virtue
of the second approach is the possibility to work with the extended patterns
giving more intelligent description of analysed pictures. However,
in this case the solution technics of the approximation
problem becomes essentially complicated. The problem becomes multiextreme,
demanding basically for its solution to use the initial approximations
obtained outside of this approach. Besides, an usual use of the threshold
memberships functions leads to instability of the approximation process...
And
if the problem of choice of initial approximations basically is solved
on the base of the first approach - detections of the simplest patterns
- the problem of incorrectness of threshold rejection of outside
points till now practically was not solved.
Here
the bell-like (fuzzy) memberships functions play the main role. Replacement
of threshold function on the bell-like one, at build-up of the conformity measure
of approximating models (segments) and described data (contour boundaries),
allows to loose criticality at definition of a membership of elements
of input data to an individual approximated pattern. The bell-like memberships
functions smooths ruptures of the conformity function caused by discretization of representation
of contour boundaries, and also by random interferences that allows to apply
simple gradient procedures at search of its extremums. Besides,expansion
of the foundation of searched maximums (caused by branches the of bell-like
memberships functions) causes smaller criticality in a choice of initial
approximations. Experiments (including ones with actualon) have confirmed
validity of these ideads (see section 2.2.).
As
a whole, the analysis of particularities of various approaches to a solution
of the problem of approximation of contour boundaries leads to a conclusion
about expediency of their complex, sequential use. In the beginning, with
the help of procedures of pure root-mean-square approximation the
contour image can be described in terms of the simplest linear elements.
Then, best of them (values of a deviation defined by minimum values) should
be used as initial approximations for the subsequent procedure of maximization
of the "gently selective" conformity
measure, obtaining in outcome the description with extended segments.
Then, in a case of need, it is possible to arrange parameters of these
segments as an integral set, redistributing contour points between them.
In
conclusion of this chapter it is necessary to point on common methodological
virtues of the concept of bell-like - fuzzy - memberships functions. Basically,
in the problem of the description of real contours, application of probability
estimations of a membership of contour points to an individual pattern
[14, 15, 16] is possible. However, as the experiments
show, the statistical model of contour boundaries (being the base of this
approach) in which signals are rectangular edges (ideal segments), deformed
by normal noise, is the theoretical idealization rather far from the reality.
Actual distortions of contour boundaries are various curvatures, stains,
extractions, etc. which count in statistical models calls essential difficulties,
and abstract from the essence of the solved problem. The essence of this
problem in this case consists in leading an approximating segment on
the axial line of the representatede piece of contour boundaries, with correct
restriction of influence of outside points.
The
solution of the problem of description of contour boundaries in terms
of segments of axial lines as problems of search of maximums of bell-conformity, with postulation of fuzzy - bell-like memberships functions,
seems to be more fruitful, than designing of strict models of researched
signals. Thus, concerning these signals the most common properties are
assumed only, namely - a significant sparseness of a set of segments
of lines , each of which can be deformed by individual ejections, curvatures,
etc.
Told above it is possible to supplement with the
statement expressed in work [17] : "... Inclining
of many contributors that the theory of statistical solutions gives any
more strict and objective classification, than other algorithms of a decision
making, is formalistic fallacy... The objective measure (proximity) is
not present due to subjective character of statement of the problem of pattern
recognition... More important, evidently, is the problem on simplicity
of definition of of proximity (conformity) measure...". For many problems
there is enough to use concepts of fuzzy (bell-like) memberships functions
and based on it a measure of geometrical conformity, as, for example, in
the Thus, build-up and modification of procedures of segmentation-approximations
become much simpler.
For example, quite naturally the necessary on the
course of problem solution changes of memberships functions width and
illegibility of ends of the approximating segments (see the subsequent
sections), are introduced naturally enough.
Deriving
of any strict analytical estimations describing these phenomena generally,
is represented rather by a complicated problem. Here, obviously, experimental
researches should play the principal role. As rough estimations it is possible
to use outcomes of the analysis of the simplest case, namely a case of
two parallel segments. The cross-section of the given picture is shown
on fig.5a. The position of segments here is determined by points x0 and
-x0, and the position of the axial line of an approximating segment is
determined by parameter x.

|
| Fig.5a |
The
analytical researches, which have been carried out on the basis of proposed
expression of function of a membership, have shown, that the conformity
function in this case has the separate maximums corresponding two parallel
segments if the width of membership function has value smaller than the
distance between these segments, enlarged in sqrt(3) times (fig.5b).

|
| Fig.5b
|
If it not so, the maximums merge in one (fig.5c).
The proof of this statement is reduced in Appendix
1.6.A.

|
| Fig.5c
|
Positions
of maximums depending on a value of parameter D are shown on fig.5d. In
this figure to keep correspondence of the horizontal axis to the previous
figures, explanatory variable D is registered on the vertical axis. The
error of an estimation of a position of search segments on maximums of the
considered conformity measure sharply decreases with decrease of width of
the.membership function. For example, already at D < x_0 does not exceed
0.1 values of distance between segments, and at D < 0.5*x_0 - 0.01 same
values.

|
| Fig.5d
|
The exibited outcomes of analytical researches allow
to estimate conditions of confluence of adjacent points of approximated
contours. At width of the membership function exceeding a step of representation
discretization of researched contour segments more than in sqrt(3) times,
the conformity function will have one common local maximum for each two
adjacent points, even at transition of an approximating line is perpendicular
to a segment connecting these points.
Correction
of the membership function is suggested to be realized by direct introduction
of its width in the number of search parameters of conformity measure
and a use of such membership function at which the amplitude at its width
decrease will increase (fig.6a):

|
|
| Fig.6a |

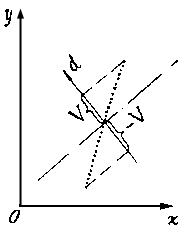
In
this case, at each fixed declination of the axial line, the local maximum
of such measure is reached at D = 0.7*V, where V - a relative half-width
of a representation segment (half of length its projections to a direction,
perpendicular to a flowing direction of the axial line, fig.6b). During
search of the next maximum of such conformity with decrease of a mismatch
between a represantation segment and the axial line a width of membership
function will decrease accordingly, ensuring thus a necessary exactitude
of definition of a segment position.
|
| Fig.6b |
Such measure of a conformity feels a relative
segment width. It is related to that now, at increase of the width of membership
function simultaneously with increase of the contribution
of the remouted points in the value of conformity function, the contribution
of the points close to the axial line decreases. And the equilibrium between
changes of these contributions occurs at a final value of parameter D,
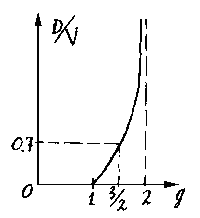
when the numerator in expression for the conformity measure of D\g (governing
growth rate of amplitude) has the exponent laying in an interval 1 <g
<2 (fig.6c).
|
| Fig.6c |
Here
the graph of values of ratio D/V, at which the conformity measure has
the maximum value depending on parameter g, is shown. This statement
is proved in Appendix 1.7.A.
In the given work the value of an exponent g = 3/2 was used, that simplifies
evaluations and leads in steady tracing behind a relative segment width.
Thus, as it was already marked, D = 0.7*V.